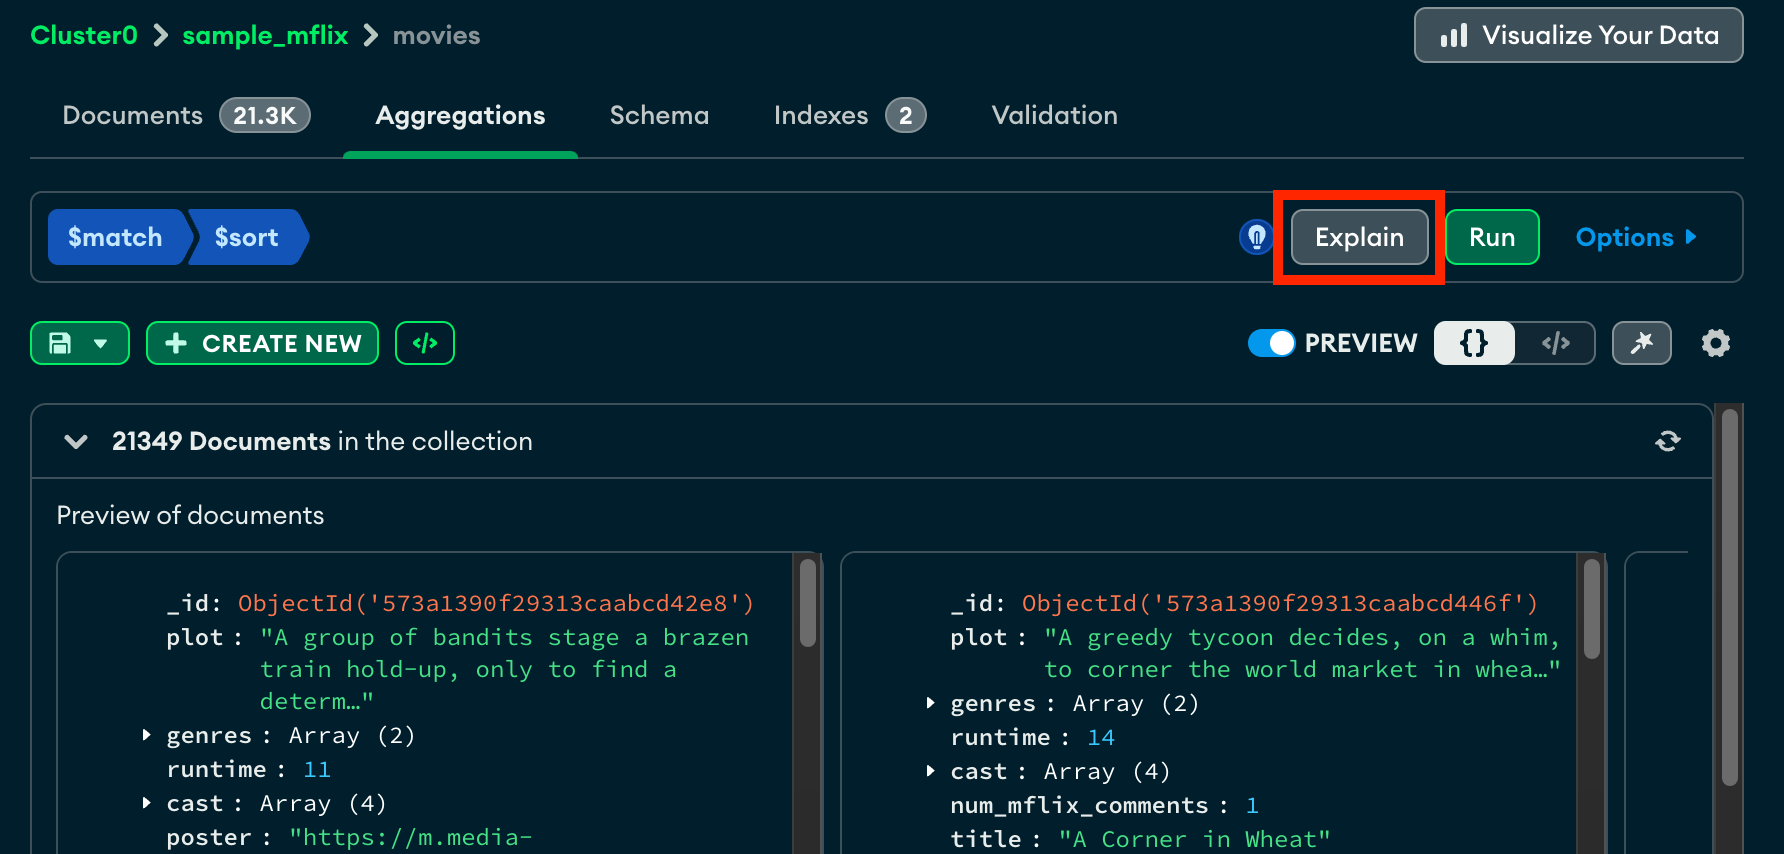
To help you better understand the performance of your pipeline, you can view your pipeline's explain plan. You can view the explain plan at any point while creating or editing your pipeline.
About this Task
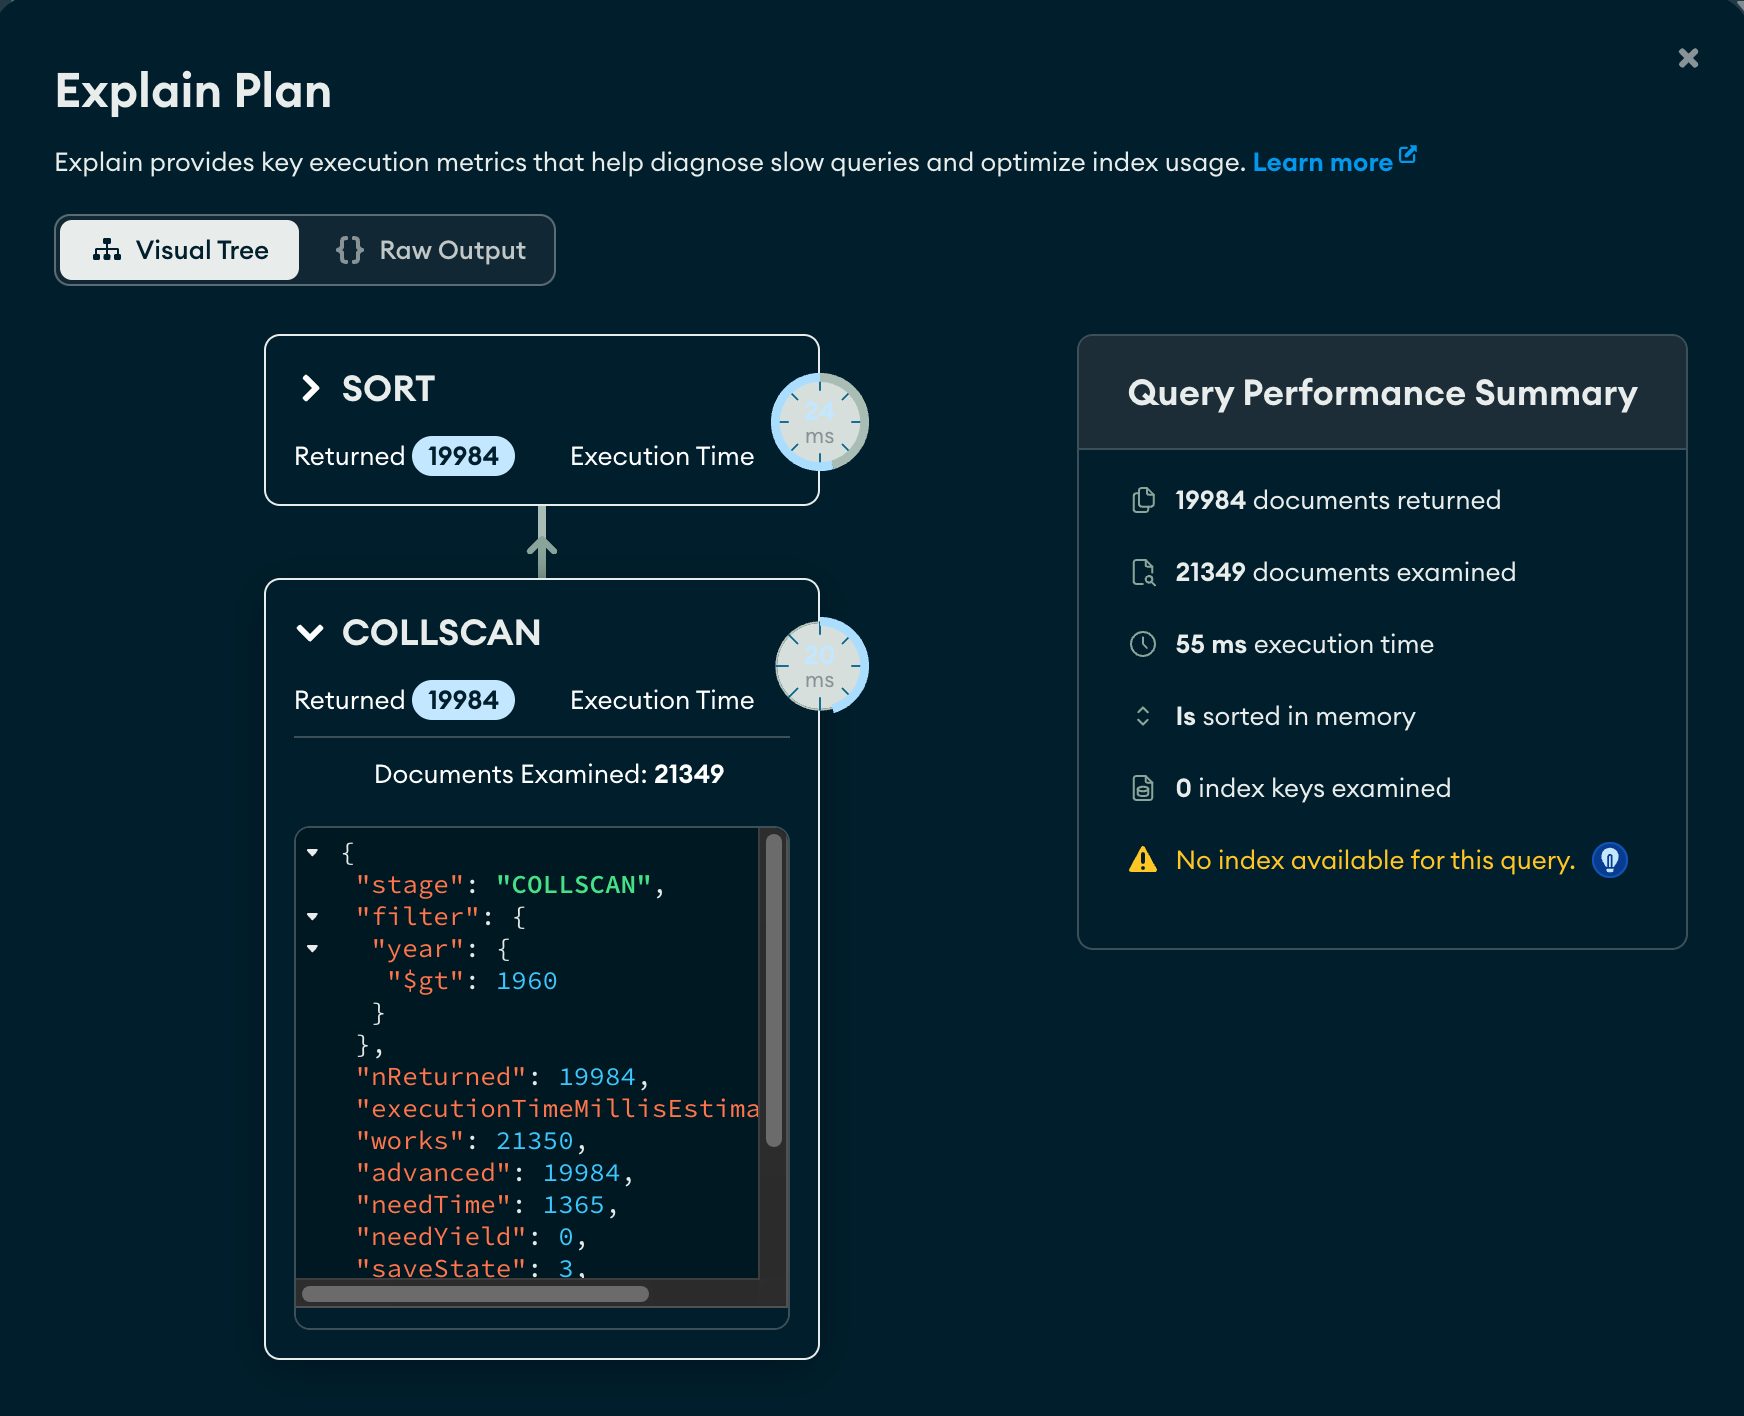
On the Explain modal, you can view the explain stages as a Visual Tree, where each stage of the pipeline appears as a node on the tree. Alternatively, you can view the explain details in raw JSON format by selecting the Raw Output view.
The explain plan includes a Query Performance Summary with information on the execution of your aggregation pipeline such as:
Execution time
The number of returned documents
The number of examined documents
The number of examined index keys
Steps
In Atlas, go to the Data Explorer page for your project.
If it's not already displayed, select the organization that contains your project from the Organizations menu in the navigation bar.
If it's not already displayed, select your project from the Projects menu in the navigation bar.
In the sidebar, click Data Explorer under the Database heading.
The Data Explorer displays.
Note
You can also go to the Clusters page, and click Data Explorer under the Shortcuts heading.